Development Workflows
Complete workflows for personal Python development: cells, REPL integration, testing, LSP features, and multi-format support
Technical Stack
Resources
Overview
This configuration supports multiple Python development workflows, unified under the Python Commander interface. All commands are accessible via C-c p, eliminating the need to memorize disparate keybindings.
Python Commander Tour
The central interface for all Python operations:
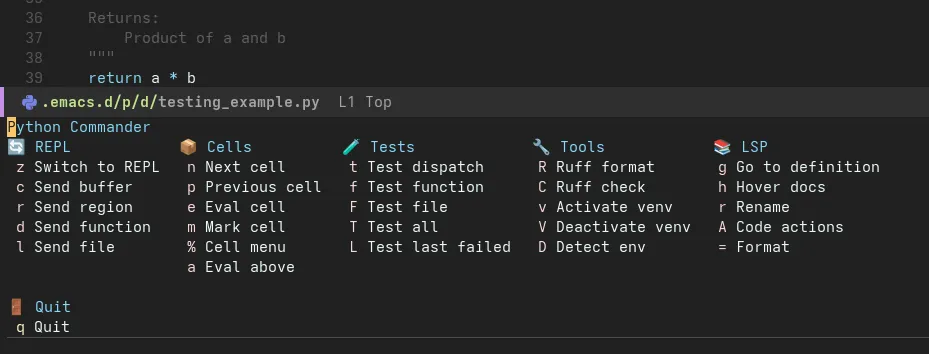
Press C-c p to access all Python commands in one menu
Command Categories
| Section | Purpose | Key Commands |
|---|---|---|
| Cells | Notebook-style development | c Edit cell, e Eval cell, SPC Eval above |
| REPL | Interactive Python | z Start REPL, r Send region, f Send function, b Send buffer |
| LSP | Code intelligence | f Format, a Code actions, d Show doc, R Rename |
| Testing | pytest integration | t Run tests, T Pytest options, m Run marked tests |
| Tools | Environment & packages | v Activate venv, i Install package, L Lint buffer |
Workflow 1: Iterative Development with Cells
Concept
Cells divide Python files into executable sections using # %% markers, similar to Jupyter notebooks but in plain .py files.
Example File
# %% [markdown]
# # Sales Data Analysis
#
# This notebook analyzes quarterly sales data to identify trends.

# %% Setup
import pandas as pd
import numpy as np
import matplotlib.pyplot as plt

DATA_PATH = "data/sales_q1_2024.csv"

# %% Load data
df = pd.read_csv(DATA_PATH)
print(f"Loaded {len(df)} records")
print(df.head())

# %% Data cleaning
# Remove duplicates and handle missing values
df_clean = df.drop_duplicates(subset=["transaction_id"])
df_clean["revenue"] = df_clean["revenue"].fillna(0)

print(f"Removed {len(df) - len(df_clean)} duplicates")

# %% Analysis
monthly_revenue = df_clean.groupby("month")["revenue"].sum()
top_products = df_clean.groupby("product")["revenue"].sum().nlargest(10)

print("Monthly Revenue:")
print(monthly_revenue)

# %% Visualization
fig, (ax1, ax2) = plt.subplots(1, 2, figsize=(12, 4))

monthly_revenue.plot(kind="bar", ax=ax1, title="Monthly Revenue")
top_products.plot(kind="barh", ax=ax2, title="Top 10 Products")

plt.tight_layout()
plt.savefig("output/sales_analysis.png")
Commands
| Command | Keybinding | Effect |
|---|---|---|
| Eval current cell | C-c p e | Execute cell at point in REPL |
| Eval above | C-c p SPC | Execute all cells from start to point |
| Edit cell | C-c p c | Open cell in popup buffer (isolation) |
| Next/Previous cell | C-c p n/p | Navigate between cells |
| Comment marker | C-c p ; | Toggle # %% marker visibility |
Workflow Demo
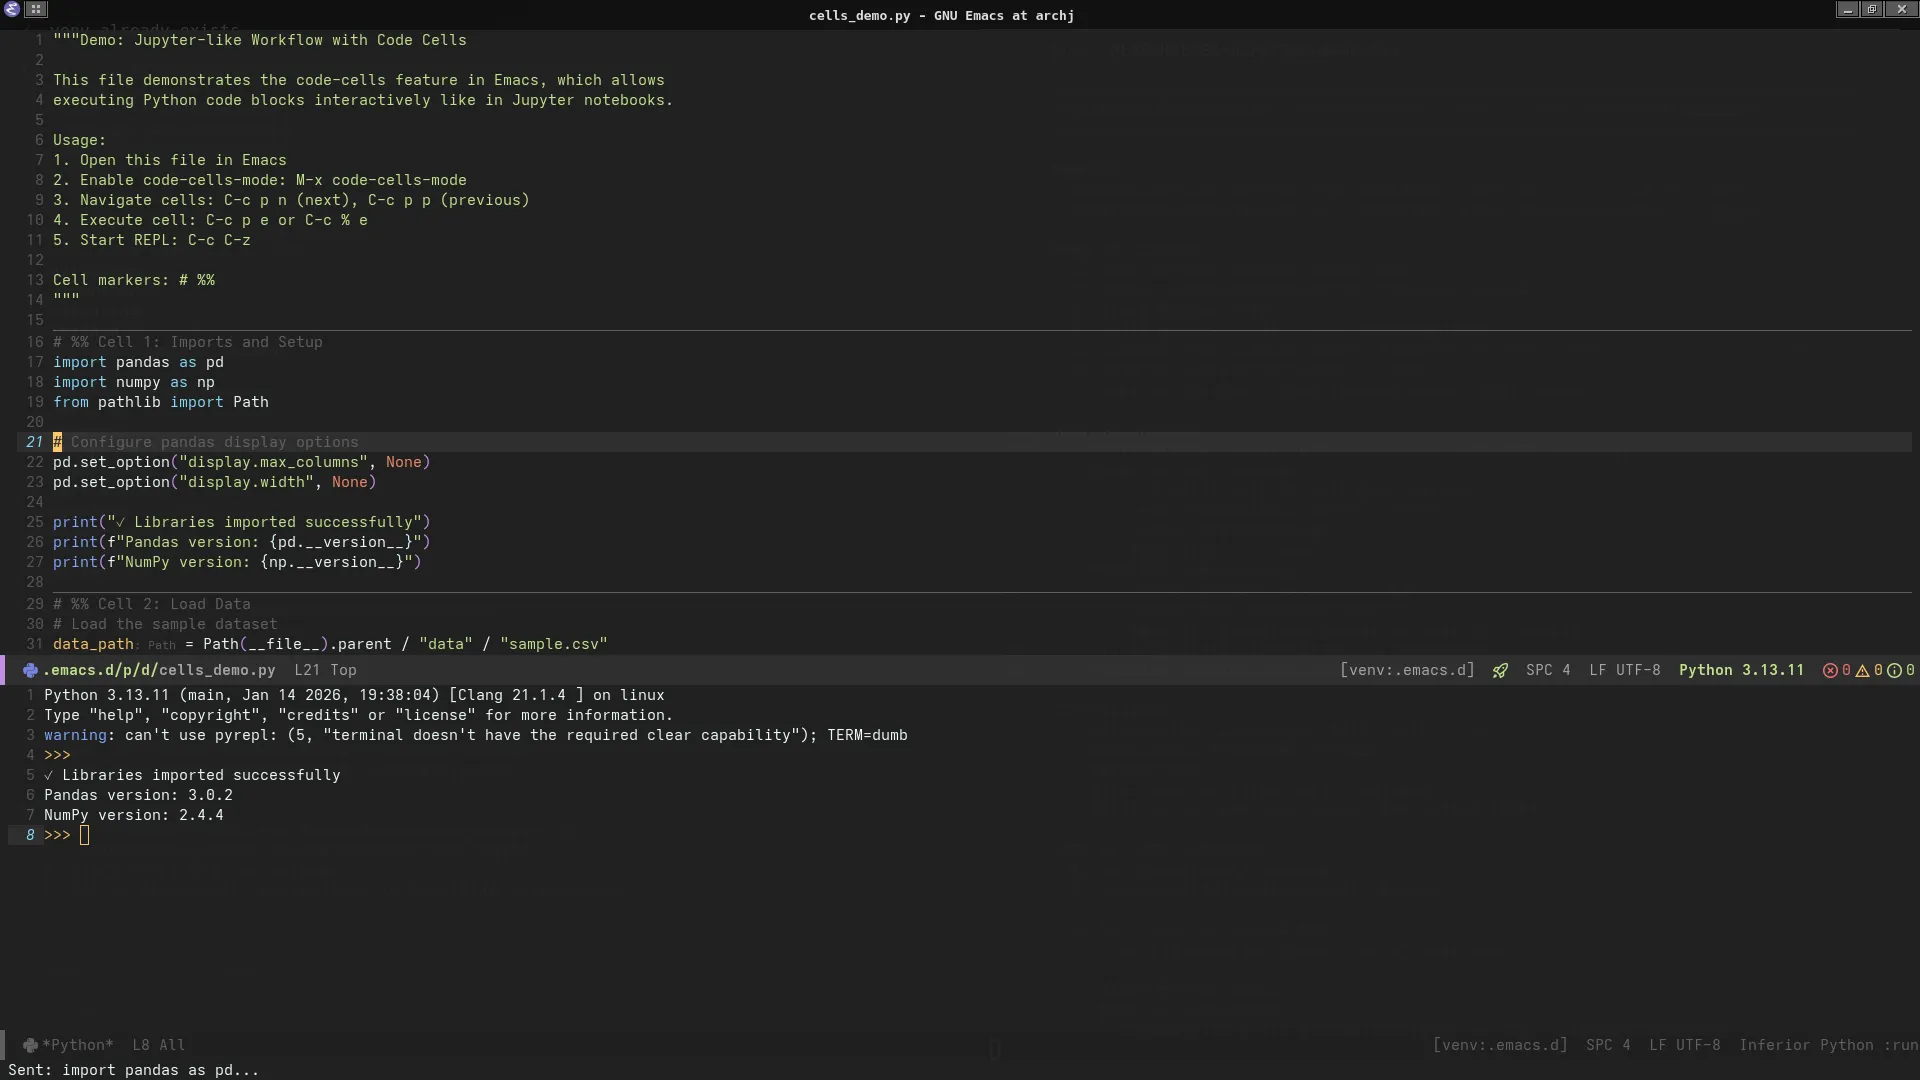
Cell-based development with REPL output side-by-side
Steps:
- Open
cells_demo.py C-c p z→ Start IPython REPLC-c p SPC→ Evaluate setup + load cells- Position cursor in analysis cell
C-c p e→ Execute analysis, see results in REPL- Modify code,
C-c p eagain → Instant feedback
Benefits
- Incremental development: Test code section-by-section
- Version control friendly: Plain Python files, not notebooks
- IDE features: Full LSP support (no Jupyter kernel needed)
- Reproducibility: Execute from top to ensure cell order correctness
Workflow 2: Interactive REPL Development
Starting the REPL
;; Option 1: Through Commander
C-c p z  ; Starts IPython with project's .venv

;; Option 2: Direct command
M-x run-python
Sending Code to REPL
| Command | Keybinding | Example Use Case |
|---|---|---|
| Send region | C-c p r | Test a few lines of code |
| Send function | C-c p f | Execute function definition + body |
| Send buffer | C-c p b | Load entire module |
| Send line | C-c p l | Quick one-liner execution |
Example: Iterative Python Development
# repl_interaction.py

import pandas as pd

# Define function
def load_and_summarize(path: str) -> pd.DataFrame:
    """Load CSV and print summary statistics."""
    df = pd.read_csv(path)
    print(f"Shape: {df.shape}")
    print(f"Columns: {list(df.columns)}")
    print(f"\nSummary:\n{df.describe()}")
    return df

# Test function interactively
# Position cursor inside function, C-c p f to send
df = load_and_summarize("data/sample.csv")

# Explore interactively (C-c p r to send selection)
df["department"].value_counts()
df.groupby("department")["salary"].mean()

# Test filtering (C-c p r on selected lines)
high_earners = df[df["salary"] > df["salary"].quantile(0.9)]
print(high_earners[["name", "department", "salary"]])
Workflow:
- Write function in buffer
C-c p f→ Send function to REPL (defines it)- Select test code below
C-c p r→ Execute in REPL (uses defined function)- See output, modify, repeat
IPython Features
The REPL uses IPython for enhanced interactivity:
# Magic commands available
%timeit df.groupby("department").mean()  # Benchmark code
%pdb  # Enable automatic debugger on exception
%load_ext autoreload  # Auto-reload modules
%autoreload 2

# Shell commands
!ls data/  # List files
!head -n 5 data/sample.csv  # Preview CSV

# Help system
df?  # Show docstring
df.groupby??  # Show source code
Workflow 3: Test-Driven Development
pytest Integration
The configuration integrates pytest for test discovery and execution.
Example Test Suite
# tests/test_example.py

import pytest
import pandas as pd
from pathlib import Path

# Fixtures for reusable test data
@pytest.fixture
def sample_df():
    """Provide sample DataFrame for testing."""
    return pd.DataFrame({
        "id": [1, 2, 3, 4],
        "value": [10, 20, 30, 40],
        "category": ["A", "B", "A", "B"]
    })

@pytest.fixture
def temp_csv(tmp_path):
    """Create temporary CSV file."""
    csv_path = tmp_path / "test.csv"
    csv_path.write_text("id,value\n1,100\n2,200\n")
    return csv_path

# Parametrized tests
@pytest.mark.parametrize("input,expected", [
    (0, 0),
    (1, 1),
    (5, 120),
    (10, 3628800)
])
def test_factorial(input, expected):
    """Test factorial calculation with multiple inputs."""
    from math import factorial
    assert factorial(input) == expected

# Data validation tests
def test_dataframe_shape(sample_df):
    """Verify DataFrame has expected shape."""
    assert sample_df.shape == (4, 3)

def test_dataframe_columns(sample_df):
    """Verify DataFrame has required columns."""
    assert set(sample_df.columns) == {"id", "value", "category"}

def test_no_missing_values(sample_df):
    """Verify no null values in data."""
    assert sample_df.isnull().sum().sum() == 0

# File I/O tests
def test_csv_loading(temp_csv):
    """Verify CSV file loads correctly."""
    df = pd.read_csv(temp_csv)
    assert len(df) == 2
    assert list(df.columns) == ["id", "value"]

# Exception tests
def test_division_by_zero():
    """Verify proper error handling."""
    with pytest.raises(ZeroDivisionError):
        result = 10 / 0
Test Commands
| Command | Keybinding | Scope |
|---|---|---|
| Run all tests | C-c p t | Entire test suite |
| Run file tests | C-c p T f | Current file only |
| Run class tests | C-c p T c | Current test class |
| Run marked tests | C-c p T m | Tests with @pytest.mark.focus |
| Rerun last | C-c p T x | Repeat previous test run |
Test Output
============================= test session starts ==============================
platform linux -- Python 3.11.8, pytest-8.0.0, pluggy-1.4.0
rootdir: /home/user/projects/data-science
configfile: pyproject.toml
collected 8 items

tests/test_example.py ........                                          [100%]

============================== 8 passed in 0.12s ===============================
Continuous Testing Workflow
- Write test function (e.g.,
test_data_loading()) C-c p t→ Run tests (see failure)- Write implementation in main module
C-c p t→ Run tests again (see progress)- Iterate until all tests pass
- Commit with confidence
Workflow 4: LSP-Powered Development
Features Demo
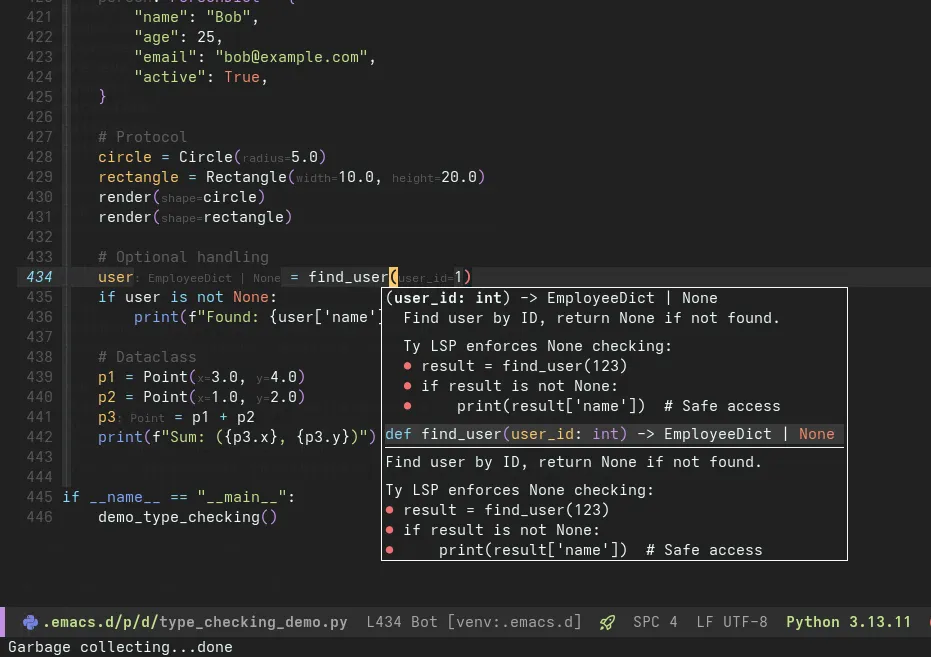
Hover documentation, auto-completion, and diagnostics in action
Feature: Hover Documentation
Trigger: Move cursor over symbol, wait 200ms
Shows: Type information, docstrings, parameter signatures
import pandas as pd

df = pd.read_csv("data.csv")  # Hover over 'read_csv' shows:
# read_csv(filepath_or_buffer, sep=',', header='infer', ...)
# Read a comma-separated values (csv) file into DataFrame.
#
# Returns: DataFrame
Feature: Auto-Completion
Trigger: Start typing, or C-M-i to force
Shows: Context-aware suggestions with type hints
df: pd.DataFrame = load_data()
df.gro  # Completion suggests:
# • groupby(by, axis, ...)  → DataFrameGroupBy
# • growing() → bool
Completion sources:
- LSP (function signatures, types)
- Local variables (buffer scope)
- Imports (available modules)
Feature: Go to Definition
Command: C-c p D or M-.
Effect: Jump to symbol definition (even in external packages)
from sklearn.linear_model import LogisticRegression

model = LogisticRegression()  # C-c p D on 'LogisticRegression'
# → Opens sklearn/linear_model/_logistic.py at class definition
Feature: Find References
Command: C-c p g
Shows: All usages of symbol in project
def calculate_metrics(df: pd.DataFrame) -> dict:
    # Find references to 'calculate_metrics'
    # Shows: 3 references found
    # 1. analysis.py:45 - result = calculate_metrics(data)
    # 2. tests/test_analysis.py:12 - from analysis import calculate_metrics
    # 3. tests/test_analysis.py:20 - metrics = calculate_metrics(sample_df)
Feature: Rename Symbol
Command: C-c p R
Effect: Rename symbol everywhere (safe refactoring)
def process_data(df):  # C-c p R, new name: 'transform_data'
    # Renames:
    # - Function definition
    # - All call sites in project
    # - Import statements
    # - Test references
Feature: Code Actions
Command: C-c p a
Shows: Context-specific fixes and refactorings
import pandas as pd
import numpy as np
import sys  # Unused import

# Code actions suggest:
# • Remove unused import 'sys'
# • Sort imports alphabetically
# • Add type hints to function
Feature: Real-Time Diagnostics
Errors and warnings appear inline with Flymake:
def analyze(data):  # Warning: Missing type hints
    result = data / 0  # Error: Division by zero (static analysis)
    return result.unknown_method()  # Error: 'float' has no attribute 'unknown_method'
Navigation:
M-n→ Next diagnosticM-p→ Previous diagnostic- Hover over underlined code for details
Workflow 5: Multi-Format Support
CSV Analysis
;; Open CSV in aligned mode
;; Navigate by field: TAB (next), S-TAB (previous)
;; Sort by column: C-c C-s (choose column)
Example data/sample.csv:
id    | name           | department | salary  | hire_date  | performance
------|----------------|------------|---------|------------|-------------
1     | Alice Johnson  | Engineering| 95000.0 | 2020-01-15 | Excellent
2     | Bob Smith      | Sales      | 75000.0 | 2019-06-01 | Good
3     | Carol White    |            | 88000.0 | 2021-03-10 | Excellent
Commands:
C-c C-a→ Toggle alignmentC-c C-s→ Sort by column (interactive)C-c C-k→ Kill columnC-c C-y→ Yank column
Markdown with Code Blocks
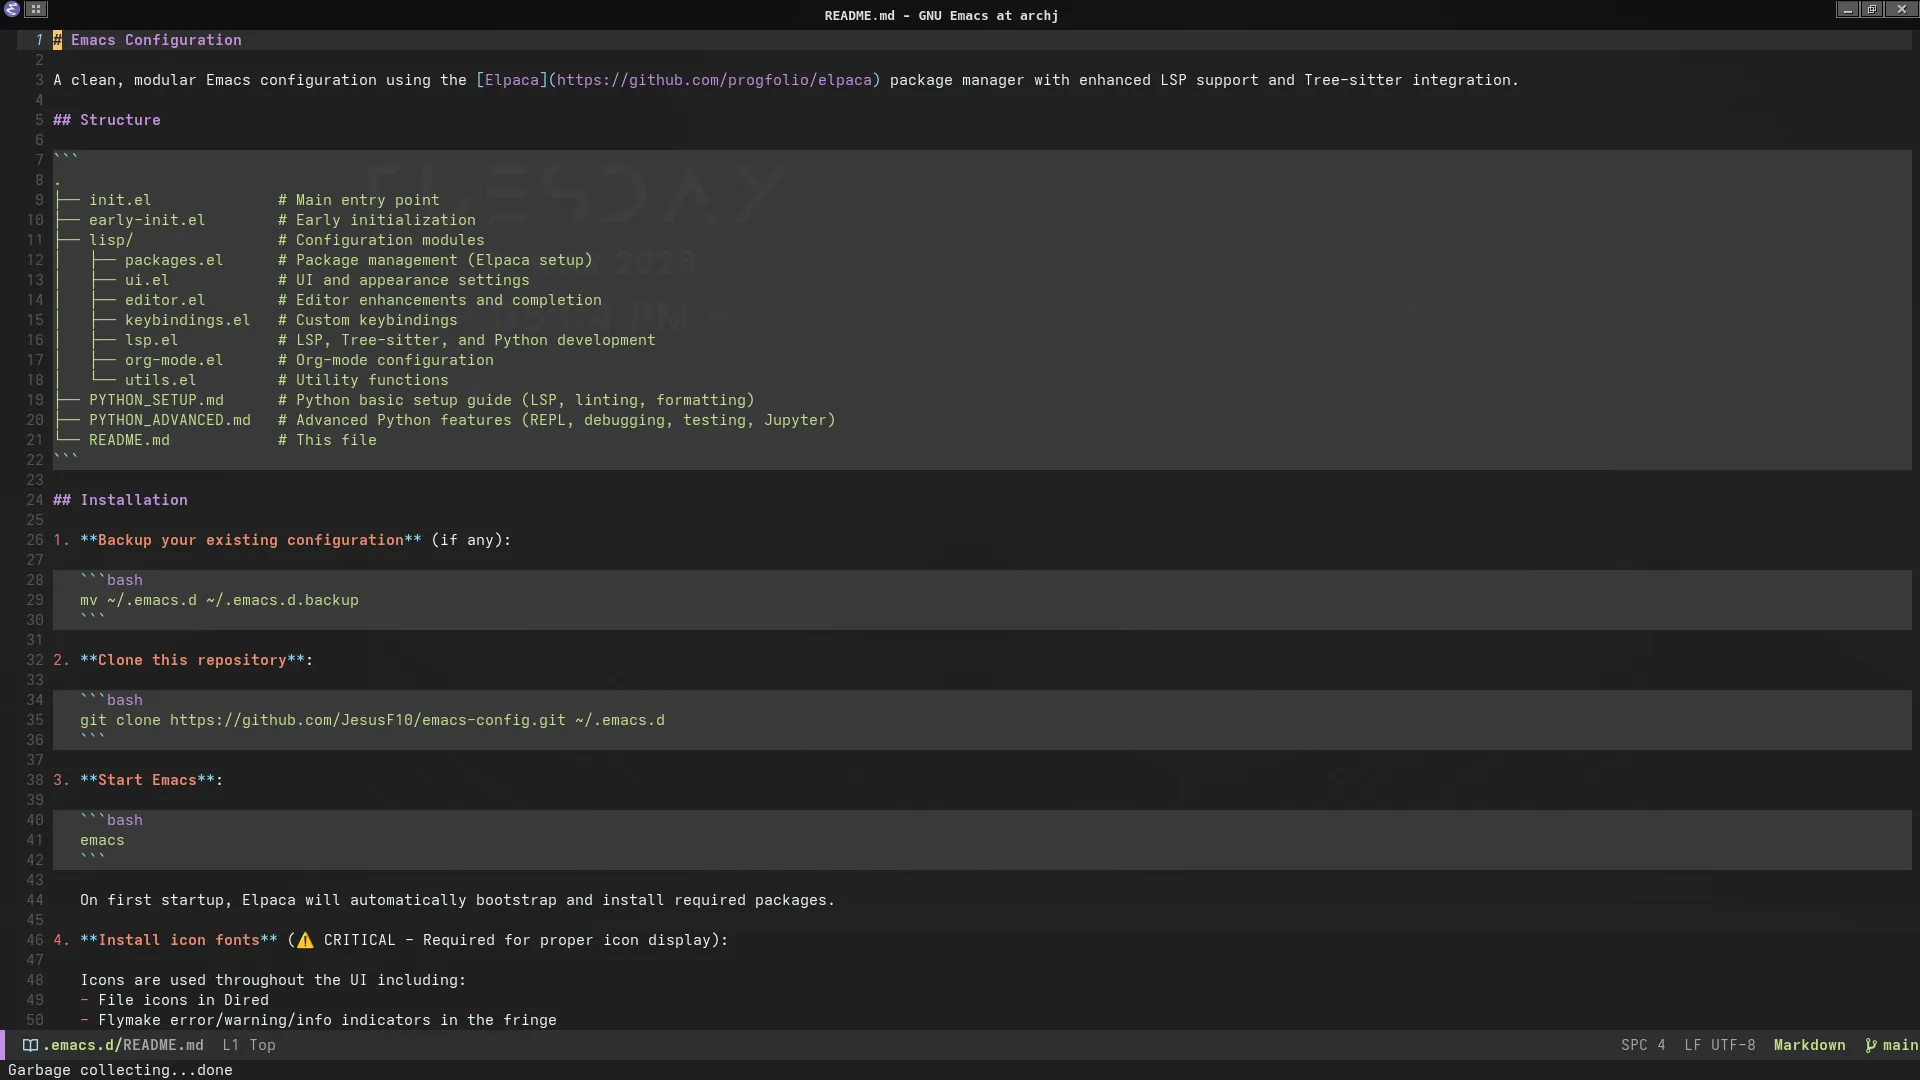
Tree-sitter Markdown with Python code block highlighting
Example analysis_report.md:
# Q1 2024 Sales Analysis

## Executive Summary

Revenue increased 15% YoY, driven by strong performance in the Western region.

## Methodology

Data processing pipeline implemented in Python:

```python
def process_sales_data(df: pd.DataFrame) -> pd.DataFrame:
    """Clean and aggregate sales data."""
    df_clean = df.dropna(subset=["revenue"])
    df_agg = df_clean.groupby(["region", "product"]).agg({
        "revenue": "sum",
        "quantity": "sum"
    })
    return df_agg
```

## Results

| Region | Revenue | Growth |
| ------ | ------- | ------ |
| West   | $2.5M   | +22%   |
| East   | $1.8M   | +8%    |
Features:
- Syntax highlighting inside code blocks (Python, Shell, SQL)
- LaTeX math rendering:
$\bar{x} = \frac{1}{n}\sum_{i=1}^{n} x_i$ - Static HTML preview with
M-x markdown-preview(opens in browser via Pandoc) - Export to HTML with code highlighting preserved
Configuration Files (TOML)
Example pyproject.toml with syntax highlighting:
[project]
name = "data-analysis-toolkit"
version = "0.1.0"
requires-python = ">=3.11"
dependencies = [
    "pandas>=2.0",
    "numpy>=1.24",
    "scikit-learn>=1.3"
]

[tool.ty]
strict = true
ignore-missing-imports = ["sklearn", "tensorflow"]

[tool.ruff]
line-length = 88
select = ["E", "F", "I", "N", "W"]

[tool.ruff.lint.per-file-ignores]
"tests/*.py" = ["F401"]  # Allow unused imports in tests
Tree-sitter features:
- Accurate parsing (no regex mistakes)
- Indentation-aware folding
- Semantic navigation (move by section)
Workflow Summary Table
| Workflow | Primary Tools | Key Commands | Use When |
|---|---|---|---|
| Cells | code-cells.el, IPython | C-c p e, C-c p SPC | Exploratory data analysis |
| REPL | python.el, IPython | C-c p z, C-c p r/f | Interactive testing, debugging |
| Testing | pytest.el | C-c p t, C-c p T f | TDD, regression testing |
| LSP | Eglot, Ty | C-c p f/a/d/R | Refactoring, code navigation |
| CSV | csv-mode | C-c C-s, TAB | Data inspection |
| Markdown | markdown-mode | Static preview (Pandoc) | Documentation, reports |